Have you ever been presented with a spreadsheet filled with colourful columns and impressive charts - yet not knowing what all of this data represents? Collecting the data is one thing. Making sense of it, well that’s another.
Read further to learn about how you can interpret data in an insightful way to benefit your organization.

Marketing is all about the numbers, making it easy to get lost in all of the data. The key to building your marketing strategy is to translate your organization’s marketing goals into hard targets to consistently monitor and report on each quarter. Data is extremely easy to misinterpret and miss out on key performance indicators (KPIs) that could be integral to your organization. In this blog, we are going to dive into how you can properly interpret data in a way that is beneficial to your organization, and ultimately grasp a high-level understanding on the importance of interpreting data to make stronger business decisions.
Integrating reporting into your organization’s digital marketing process is essential. It’s about identifying and by gathering the right data, and interpreting it to make informed decisions. We also advocate that you track the data to validate your choices.
Now let’s get into a discussion on how to interpret data.
What is Data Interpretation?
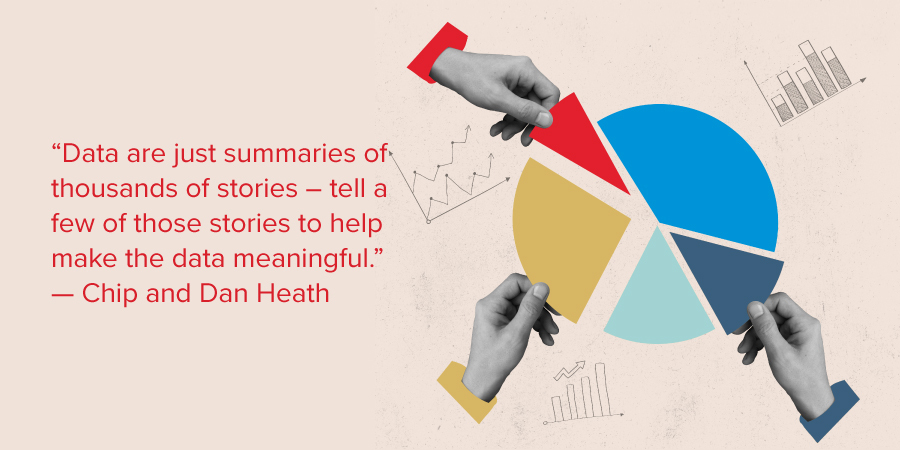
All data tells a story, and when read correctly a smart marketer is able to improve an organization's performance. Aside from setting the right key performance indicators (KPIs) such as social media traffic and lead conversion rates, you must first choose metrics that you can analyze on a consistent basis over time so you can connect those metrics back to your business goals.
Insights capture what humans are doing, while metrics help you capture the subject matter most valuable to your company. Interpreting data is not just about monitoring click through rates and engagement and it is crucial to understand the human side of interpreting data. We have some pointers to help you do that.
Key Data Points
Here are some helpful beginner key data points you can use when interpreting your organization’s metrics:
- Lead Generation KPIs: Lead generation KPIs such as new signups, returning visitors, sales calls booked, and quote requests are all examples of important KPI’s to include in your data reporting.
- Search Engine Optimization KPIs: Clear SEO KPIs including ROI (Return on Investment), organic visibility, organic sessions and keyword ranking are straightforward and excellent examples of data points you can communicate within your organization. Platforms like SEMrush, Ahrefs, SEO spider and many more are able to generate automatic reports that showcase all of these KPIs and more.
- Sales/lead growth KPIs: Sales and lead growth KPIs are an essential part of your digital marketing reporting and foster effective communication between the sales and marketing team.
Avoid Reacting to Data Highs and Lows

Just like life, data has natural highs and lows. It is important to remember that data is driven by human reactions, and current events taking place in the world have the potential to cause a massive data swing. World events like weather events, Canadian tax deadlines, and COVID are all examples of events that swayed consumer data and caused a mass reaction which impacts your client’s website traffic. Instead of reacting to the potential loss of website traffic, you must dig a little deeper into the history of data and current events that were taking place during that time.
Managing Expectations With Industry-Specific Benchmarks
Marketing KPIs and Click-through-rate per industry can vary widely. Comparing back to school consumer packaged goods advertisements in September to B2B promotional efforts during the holiday season is simply unfair. Instead of just determining a standard target, try implementing industry-specific benchmarks that display a clear indication of what the industry standard is. Calculating an industry standard is helpful for your marketing efforts to get a strong understanding of how each business compares to competitors. This calculation provides an opportunity for discussion on best practices to improve your marketing strategy.
Case Study
Although it can be daunting as a beginner to understand how to interpret marketing data, we are here every step of the way to help guide you through the process and provide insightful, professional tips. Once learned, interpreting data correctly can have an extremely beneficial impact on your organization as a whole.
We encourage you to check out Ballard Power Systems case study to observe thought leadership established through inbound marketing processes.
Perry Boeker
Principal & Marketing Strategist A results-driven creative thinker, Perry is a marketing management professional with a proven record of achievement in Strategic Planning, Team Leadership, and New Concepts Development.


